Skip to content
Talking about all things ETFs.
The
ETF Tracker
by
Markets
Portfolio
Issuers
Visualizations
Compare
⌕
Portfolio →
Visualizations
Loading charts…
Skip to content
VTI
▼ −0.2%
VOO
▼ −0.4%
IVV
▼ −0.3%
SPY
▼ −0.4%
VXUS
▼ −0.1%
QQQ
▼ −1.4%
VUG
▼ −1.3%
BND
▲ +0.3%
VEA
▲ +0.2%
VTV
▲ +0.9%
VO
▲ +0.8%
IEFA
▲ +0.6%
SPYM
▼ −0.3%
VGT
▼ −1.1%
VB
▲ +1.3%
VWO
▼ −0.7%
IEMG
▼ −1.3%
AGG
▲ +0.3%
GLD
▼ −1.3%
VIG
▲ +1.3%
XLK
▼ −1.2%
IJH
▲ +1.2%
IWF
▼ −1.5%
BNDX
▲ +0.1%
SCHD
▲ +1.5%
SGOV
▲ +0.0%
QQQM
▼ −1.4%
IJR
▲ +1.6%
RSP
▲ +1.2%
VT
▼ −0.2%
VTI
▼ −0.2%
VOO
▼ −0.4%
IVV
▼ −0.3%
SPY
▼ −0.4%
VXUS
▼ −0.1%
QQQ
▼ −1.4%
VUG
▼ −1.3%
BND
▲ +0.3%
VEA
▲ +0.2%
VTV
▲ +0.9%
VO
▲ +0.8%
IEFA
▲ +0.6%
SPYM
▼ −0.3%
VGT
▼ −1.1%
VB
▲ +1.3%
VWO
▼ −0.7%
IEMG
▼ −1.3%
AGG
▲ +0.3%
GLD
▼ −1.3%
VIG
▲ +1.3%
XLK
▼ −1.2%
IJH
▲ +1.2%
IWF
▼ −1.5%
BNDX
▲ +0.1%
SCHD
▲ +1.5%
SGOV
▲ +0.0%
QQQM
▼ −1.4%
IJR
▲ +1.6%
RSP
▲ +1.2%
VT
▼ −0.2%
The
ETF Tracker
by
Markets
Portfolio
Issuers
Visualizations
Compare
⌕
Portfolio →
←
All pictures
Who's winning?
›
Beat the market
Speedrun splits · Year by year, ahead or behind?
Year by year, ahead or behind?
There is not enough data to draw this picture yet.
More in Beat the market
Did it beat the Nasdaq?
Leverage ladder
Promise vs delivered
100 one-year holds
Range of past outcomes
Bear fund since launch
Also in Who's winning?
Return
Payouts
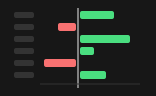 There is not enough data to draw this picture yet.