Skip to content
Talking about all things ETFs.
The
ETF Tracker
by
Markets
Portfolio
Issuers
Visualizations
Compare
⌕
Portfolio →
Visualizations
Loading charts…
Skip to content
VTI
▼ −0.2%
VOO
▼ −0.4%
IVV
▼ −0.3%
SPY
▼ −0.4%
VXUS
▼ −0.1%
QQQ
▼ −1.4%
VUG
▼ −1.3%
BND
▲ +0.3%
VEA
▲ +0.2%
VTV
▲ +0.9%
VO
▲ +0.8%
IEFA
▲ +0.6%
SPYM
▼ −0.3%
VGT
▼ −1.1%
VB
▲ +1.3%
VWO
▼ −0.7%
IEMG
▼ −1.3%
AGG
▲ +0.3%
GLD
▼ −1.3%
VIG
▲ +1.3%
XLK
▼ −1.2%
IJH
▲ +1.2%
IWF
▼ −1.5%
BNDX
▲ +0.1%
SCHD
▲ +1.5%
SGOV
▲ +0.0%
QQQM
▼ −1.4%
IJR
▲ +1.6%
RSP
▲ +1.2%
VT
▼ −0.2%
VTI
▼ −0.2%
VOO
▼ −0.4%
IVV
▼ −0.3%
SPY
▼ −0.4%
VXUS
▼ −0.1%
QQQ
▼ −1.4%
VUG
▼ −1.3%
BND
▲ +0.3%
VEA
▲ +0.2%
VTV
▲ +0.9%
VO
▲ +0.8%
IEFA
▲ +0.6%
SPYM
▼ −0.3%
VGT
▼ −1.1%
VB
▲ +1.3%
VWO
▼ −0.7%
IEMG
▼ −1.3%
AGG
▲ +0.3%
GLD
▼ −1.3%
VIG
▲ +1.3%
XLK
▼ −1.2%
IJH
▲ +1.2%
IWF
▼ −1.5%
BNDX
▲ +0.1%
SCHD
▲ +1.5%
SGOV
▲ +0.0%
QQQM
▼ −1.4%
IJR
▲ +1.6%
RSP
▲ +1.2%
VT
▼ −0.2%
The
ETF Tracker
by
Markets
Portfolio
Issuers
Visualizations
Compare
⌕
Portfolio →
←
All pictures
Who's winning?
›
Payouts
Payout pulse · Is the cash holding up?
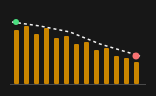
Is the cash holding up?
There is not enough data to draw this picture yet.
More in Payouts
Yield leaderboard
Income snowball
Payouts vs price lost

The scale
House-money meter
Payout history
Dividend staircase
Also in Who's winning?
Return
Beat the market